
Waveform and RGB Parade
The Waveform shows how bright the picture is across the frame. The Parade shows the same thing for red, green and blue separately. Both tell you where the picture is clipping, which is hard to judge by eye.
- Menu
- View ▸ Scopes
- Keys
- ⌃⌘W
- Where
- A slot's popup in the Scopes panel ▸ Waveform or Parade
- Agent tools
render_frame
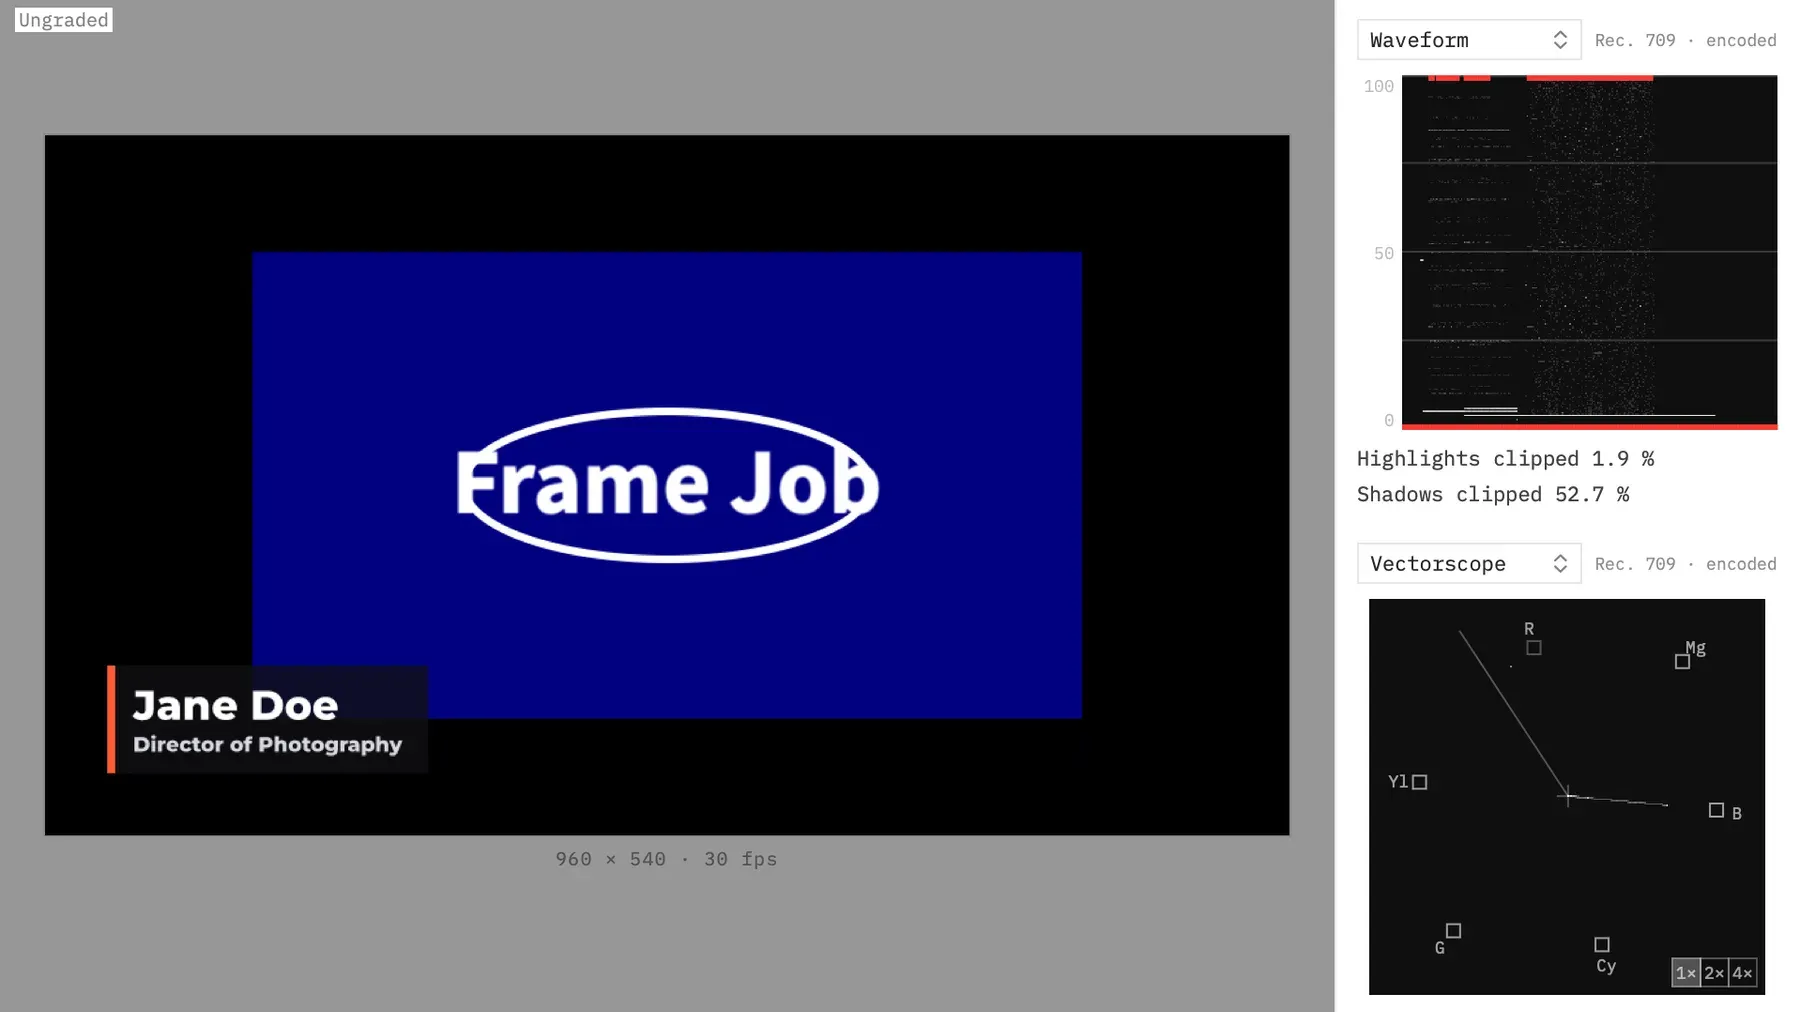
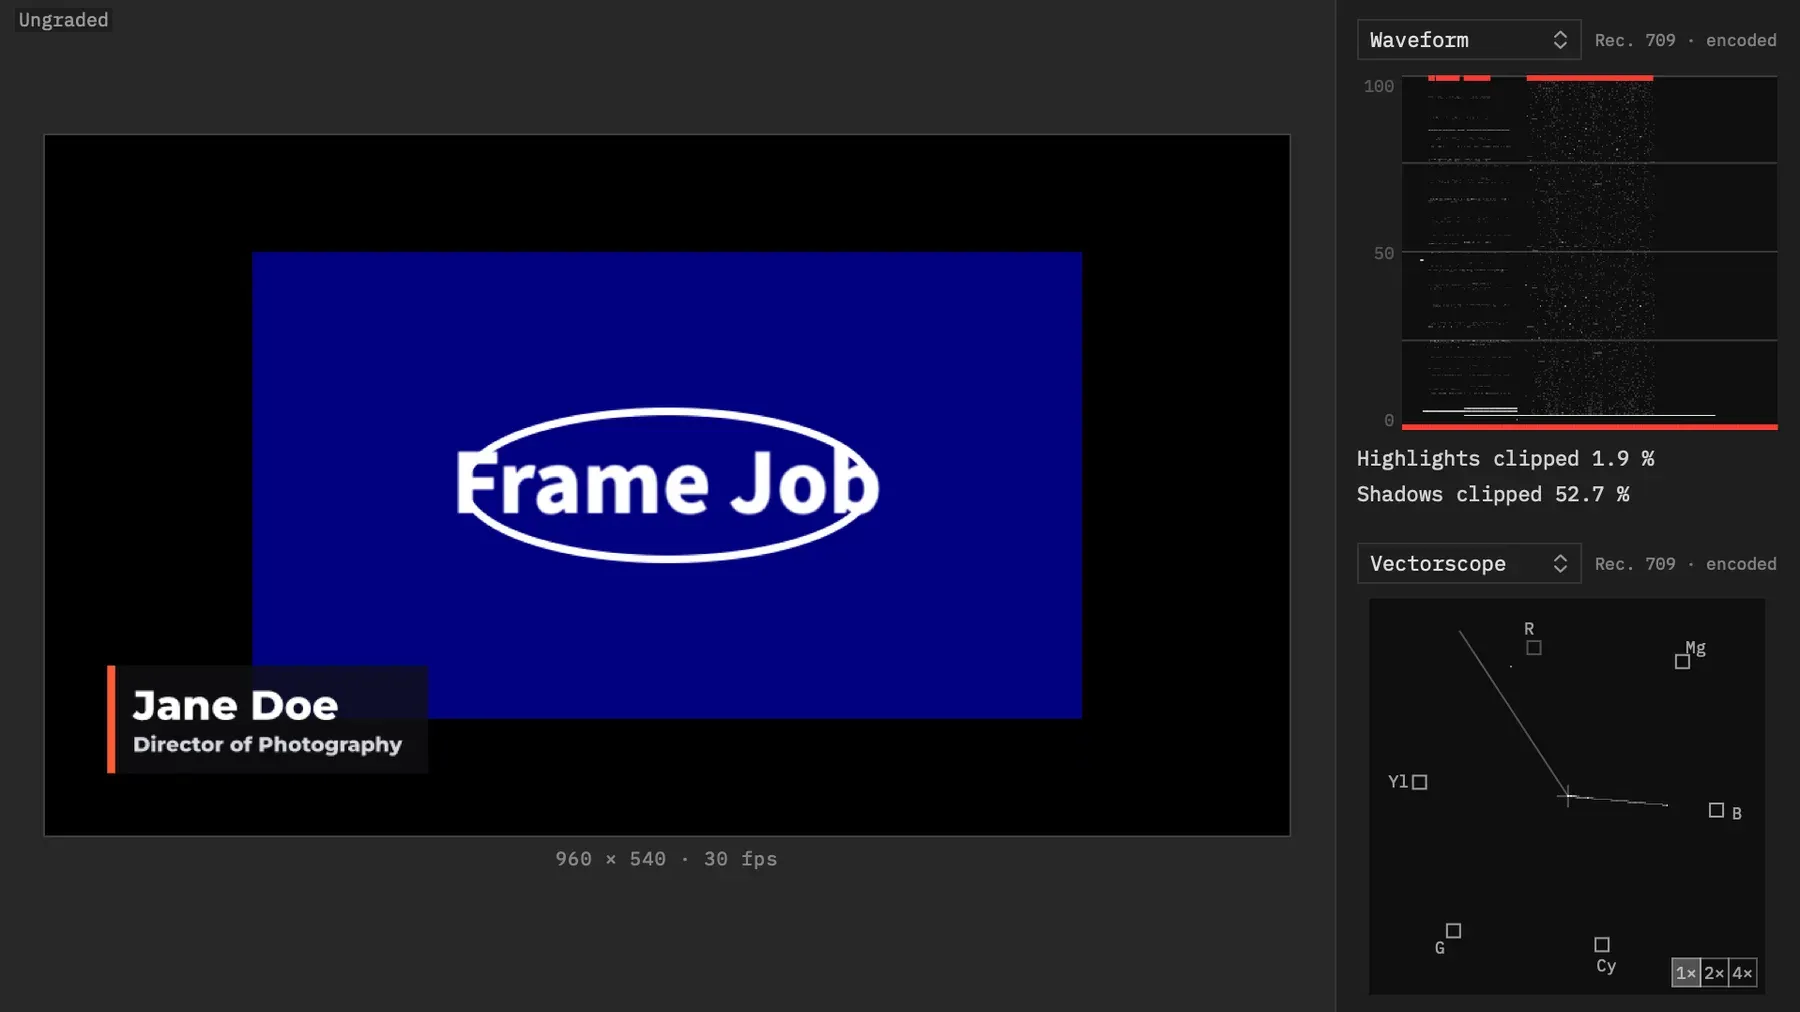
To see them, press ⌃⌘W to open the Scopes panel, then choose Waveform or Parade from a slot’s popup. A new window’s top slot is already on Waveform. Each takes 200 pt of height when the pane has room, and shrinks to fit when it doesn’t.
In an HDR project they read differently, and Scopes in an HDR project has the scale.
Read the waveform
Section titled “Read the waveform”The Waveform plots the picture’s luma (Y′, its brightness). Left to right in the scope is left to right across the frame, and height is brightness, with black at the bottom and white at the top. So a bright window on the left of the shot shows as a high patch on the left of the scope.
Lines mark 0, 25, 50, 75 and 100 %, with 0, 50 and 100 labelled at the left. The trace is white on a near-black background in both light and dark appearance. The brighter a point in the trace, the more pixels sit there, on a log scale, so a level only a few pixels reach still shows.
Read the RGB parade
Section titled “Read the RGB parade”The Parade shows red, green and blue as three waveforms side by side, in that order, each tinted its own colour. Each one works like the Waveform, with the same lines and the whole width of the frame.
Use it to see a colour cast. Something that should be neutral grey sits at the same height in all three, and a channel sitting higher or lower is pulling the picture toward or away from that colour. Temperature and Tint in Light, and the wheels, are the usual ways to bring them back in line.
Find clipping
Section titled “Find clipping”A pixel clips high at the top level, where an 8-bit file would write 255, and low at the bottom level, where it would write 0. Detail at those levels has gone flat.
Clip marks are red marks on the top and bottom edges of the scope. A mark sits over every column where at least 0.5 % of the pixels clip, on the top edge for highlights and the bottom edge for shadows, so you can see where in the frame it’s happening. The Parade marks each channel on its own, so one channel can clip when the others don’t.
Readouts under the Waveform give the share of the whole frame, for example Highlights clipped 1.9 % and Shadows clipped 52.7 %. They show “—” until a frame has been measured. The Histogram has the same two readouts. The Parade and the Vectorscope have none.
The readouts count everything in the frame. A black background around a smaller clip counts as clipped shadows, so a high figure may not be a problem with your footage. To bring highlights down, try Exposure or Highlights in Light.
The clip marks and readouts are the only warning. There’s no broadcast-safe limiter, no gamut warning and no false-colour view. An export writes this scale’s 0 to 100 % as video-range levels, so 0 and 100 % land on legal black and white.
With an agent
Section titled “With an agent”render_frame measures a frame’s Waveform or Parade without the panel. Pass waveform or parade as true. Both are false by default. The tool’s reply says what share of pixels clips high and low, and for the Parade it gives that for each channel, which the panel doesn’t show as a number.
A JSON file next to the image holds the raw counts, in 256 × 256 bins, with the clip marks and the clipping figures. It’s named <image path>.waveform.json or <image path>.parade.json, and the Parade’s holds red, green and blue separately. See Check the picture: render_frame.