
Master and RGB curves
Curves change the picture’s tones with points on a line. Use Master for contrast and the black and white points, and Red, Green and Blue to work on one colour at a time. The picture goes through the curves after the wheels and before the look.
- Keys
- ⌫⌦Esc← → ↑ ↓
- Where
- Clip tab ▸ Color ▸ CurvesRight-click a channel cell for Reset
- Agent tools
set_videoset_action_end
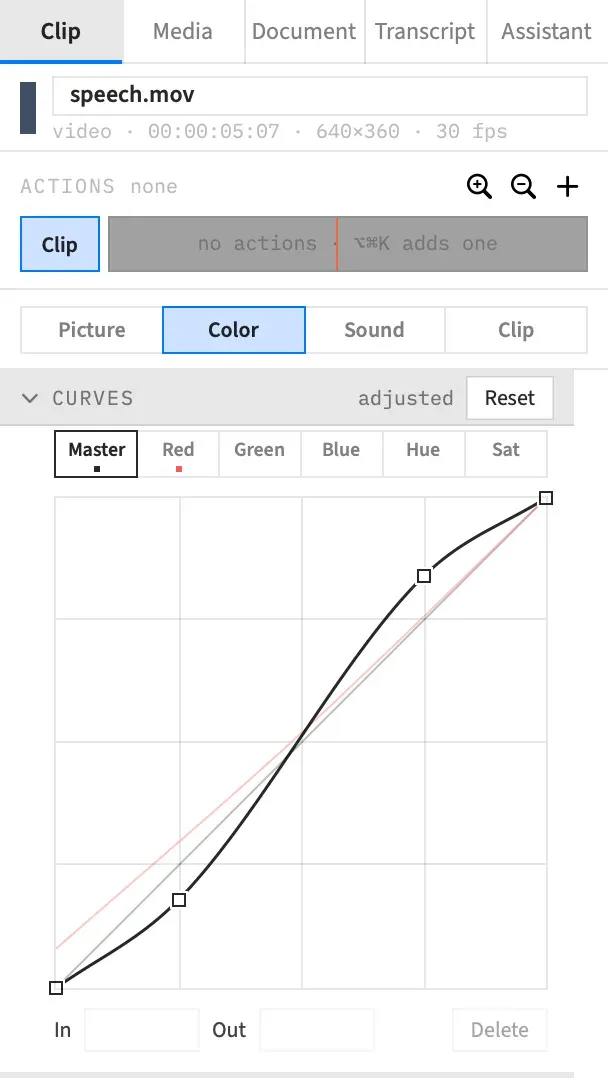
The Curves section
Section titled “The Curves section”Select a video, image or still clip, or an adjustment clip, open the Color tab and open Curves. The section starts closed, and its header reads “neutral” until a curve changes, then “adjusted”.
The section has three parts, from top to bottom:
- The channel picker, which chooses the curve you’re editing.
- The plot, a square with a 4 × 4 grid. It grows with the inspector up to 300 pt wide.
- The selected point’s In and Out fields, and Delete.
Across the plot is the level going in, from 0 at the left to 1 at the right. Up the plot is the level coming out. A thin diagonal marks a straight curve, which changes nothing.
The channel picker
Section titled “The channel picker”Six cells above the plot choose the channel you edit. Click a different cell, and any selected point is deselected.
| Cell | What it changes |
|---|---|
| Master | All three colours together. Use it for contrast and for the black and white points. |
| Red | The red channel only. |
| Green | The green channel only. |
| Blue | The blue channel only. |
| Hue | Hue vs Hue, which turns a chosen hue toward another. See Hue vs Hue and Hue vs Sat curves. |
| Sat | Hue vs Sat, which saturates or mutes a chosen hue. See Hue vs Hue and Hue vs Sat curves. |
Master, Red, Green and Blue are the tone curves, and Hue and Sat are the hue curves.
There’s no separate luma curve. Master runs first, then each colour goes through its own channel, so a Red curve works on what Master has already done.
The chosen cell is framed and labelled in its channel’s colour. A new window starts on Master, and the plot stays on your channel while the window is open. The choice isn’t saved with the project.
See which channels are changed
Section titled “See which channels are changed”A dot under a cell means that channel has been changed.
Changed channels also show as faint lines in their own colour behind the curve you’re editing. Master, Red, Green and Blue show behind each other. Hue and Sat each have their own scale, so neither shows behind the other.
Shape the picture
Section titled “Shape the picture”| To | Do this |
|---|---|
| Add contrast | On Master, make a gentle S: pull a point low on the curve down, and a point high on the curve up. |
| Set the black point | On Master, drag the first point right along the bottom. Everything darker than its In comes out black. |
| Set the white point | On Master, drag the last point left along the top. Everything brighter than its In comes out white. |
| Lift the blacks | On Master, drag the first point up the left edge. |
| Warm the shadows | On Red, drag the first point up the left edge. |
| Take out a colour cast | On the channel that’s too strong, add a point in the middle of the curve and pull it down. |
Edit points
Section titled “Edit points”A curve holds from 2 to 16 points. It runs smoothly through every point and never overshoots, so between two points it stays between their values. Past the first and last points, a tone curve stays flat.
Each drag, nudge, deletion or typed value is one undo step, and Edit ▸ Undo reads Undo Curves.
Add a point
Section titled “Add a point”Click the plot away from any point. Frame Job adds a point on the curve, directly above or below your click, and selects it. Keep the button down and the same press drags it.
A double-click on the curve itself adds one point. A double-click away from the curve adds two, side by side, because the second click misses the first point.
A 17th point beeps, and so does a click with no room left between two points.
On a straight channel, the new point isn’t saved until you move it, nudge it or type a value, so a stray click changes nothing. It stays on the plot while it’s selected, and it goes when you deselect it or change channel. You can click several in a row to pin a straight curve before you bend it, and they’re all saved with the first one you move.
On a channel that already has a shape, the click saves the new point straight away. The point lies on the curve, so the picture changes very little, if at all.
Drag a point
Section titled “Drag a point”Press a point to grab it where it stands, with no jump, and drag. It stays inside the plot and can’t pass its neighbours. The closest it gets to a neighbour across the plot is 0.001 on a tone curve and 0.1° on a hue curve.
You can drag the end points too.
Fine drag and axis lock
Section titled “Fine drag and axis lock”Hold ⌥ while you drag to move the point at a tenth of the speed.
Hold ⇧ while you drag to lock the point to one axis. It stays put until the pointer has travelled 4 pt from the press, and then whichever direction you moved further wins for the rest of the drag. Let go of ⇧ and the point follows the pointer again.
⌥ and ⇧ combine.
Nudge a point
Section titled “Nudge a point”With a point selected, the arrow keys nudge it. Hold ⇧ to go ten times as far. Each press is one undo step.
| Channel | Arrow key | With ⇧ |
|---|---|---|
| Master, Red, Green, Blue | 0.01 | 0.1 |
| Hue | 1° | 10° |
| Sat | 1° across, 0.01 up and down | 10° across, 0.1 up and down |
In and Out fields
Section titled “In and Out fields”The In and Out fields below the plot let you type the selected point’s position. With no point selected, they’re blank and disabled.
| Channel | In | Out |
|---|---|---|
| Master, Red, Green, Blue | 0 to 1, three decimals | 0 to 1, three decimals |
| Hue | 0° to 359.9°, one decimal | −180° to +180°, one decimal |
| Sat | 0° to 359.9°, one decimal | 0× to 2×, two decimals |
A number outside the range goes to the nearest end of it, and an In past a neighbouring point stops short of that point.
Delete a point
Section titled “Delete a point”Select the point and press ⌫ or ⌦, choose Delete below the plot, or double-click the point.
A curve can’t go below two points. The keys and the double-click beep, and Delete is greyed out.
Deselect a point
Section titled “Deselect a point”Press Esc, or click another channel. This also hands the keyboard back to the editor.
The plot and the keyboard
Section titled “The plot and the keyboard”While a point is selected the plot has the keyboard, so:
- The arrow keys nudge the point rather than move the playhead.
- ⌫ deletes the point, not the selected clip.
Keys the plot doesn’t use still reach the editor, so Space still plays.
Hover readout
Section titled “Hover readout”While the pointer is over the plot, and during a drag, a small label shows the pointer’s position and the curve’s value there.
| Channel | The label reads |
|---|---|
| Master, Red, Green, Blue | In 0.42 → Out 0.47 |
| Hue | Hue 34° → +12° |
| Sat | Hue 120° → ×0.80 |
There’s no label outside the plot, and that includes the spectrum strip under a hue channel.
Reset curves
Section titled “Reset curves”To straighten one channel, right-click its cell in the picker and choose Reset Master, Reset Red, Reset Green, Reset Blue, Reset Hue or Reset Sat. The item is greyed out while that channel is already straight.
To straighten all six channels, choose Reset in the section’s header. It shows while a curve is changed, and it’s one undo step. You can also right-click the plot and choose Reset to default.
Curves inside an action
Section titled “Curves inside an action”With an action selected, a curve edit goes to the action’s end, so the curve animates. Any two curves animate into each other, whatever their number of points, and so does a curve and a straight line.
The plot shows it in its own way: the action’s start curve is dashed, and the edited curve and its points are in the action colour.
To animate a curve back to neutral, right-click a cell and choose its Reset item, or right-click the plot and choose Set end value to default. Each writes a straight curve to the action’s end, for the channels that aren’t already straight. The section’s Reset isn’t there while the action is selected. Clear takes its place once the action animates curves, and removes them from the action.
See Animate a grade.
Good to know
Section titled “Good to know”With several clips selected, the plot shows the first clip’s curves, and the section shows mixed when they differ. An edit gives every selected clip the curve you’re editing, for that channel, and leaves their other channels alone.
Selecting another clip deselects the point.
With an agent
Section titled “With an agent”An agent writes a whole channel at once as a list of 2 to 16 points, and that list replaces the channel. Sending null for a channel removes its curve, and a list that changes nothing is stored as no curve.
A drag stops at a limit, but an agent’s value outside the limits gets an error and the curve stays as it was. An action’s end is the exception: the value is kept, and it’s moved to the nearest limit as the action plays. See Tools: picture and grade.